Select examples of personal and professional projects

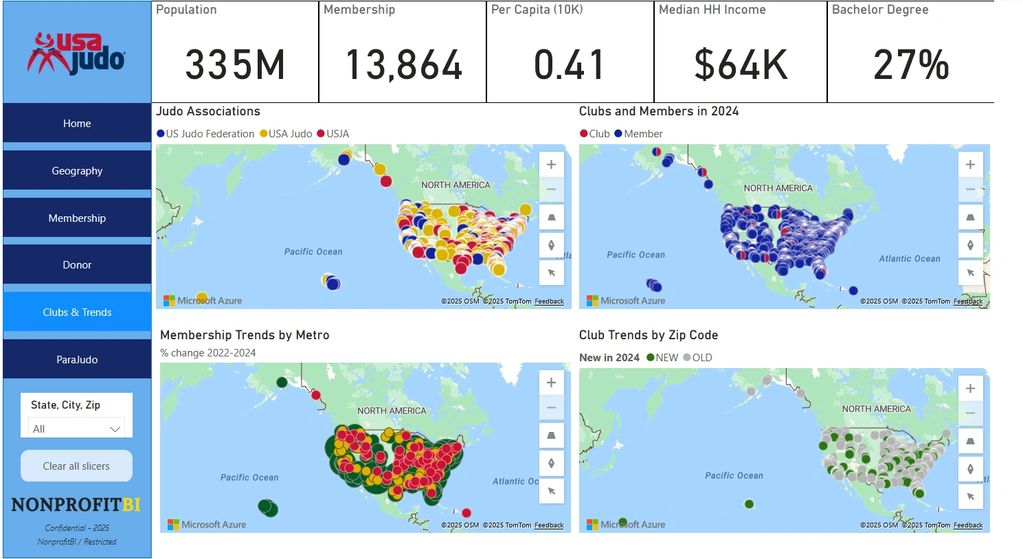
This project was presented to the Olympics USA Judo Association using Power BI maps to show a variety of demographic and club data. These maps helped them understand where their membership is growing at the metro and zip code level, as well as competing association locations.

I created a dataset of potential clients for a local startup using Google Maps API, helping them locate their potential clients and keep track of who they had contacted. I built this map in Power BI to help them plan their outreach strategy.
I developed this Shiny App to test interactive functionalities in R Shiny. It calculates the odds of a recession in the following two quarters based on user-inputted or recently published economic data. I wanted to see if I could build a model that used reactive inputs to create a prediction.
You can play with the app here if you would like:

A preliminary dashboard I put together for a client in Mexico using PowerBI. I also took INEGI (Mexican Institute of Statistics) indices to create a revenue forecast for the following year.
Values shown have been modified from original.

I built this dashboard in R using Shiny to collect socioeconomic and environmental live data from a variety of sources to stay up to date on the conditions in the economy. It has basic historical and forecasting functionalities.

